There are dozens of metrics in GA4, and most WordPress bloggers track the wrong ones. They obsess over pageviews, celebrate follower counts, and panic when daily traffic dips by 10%. Meanwhile, the WordPress blog metrics that actually predict growth sit ignored in their analytics dashboard.
I’ve spent eight years watching bloggers chase vanity numbers while their sites stagnate. The fix isn’t tracking more data — it’s tracking the right data. In this guide, I’ll walk you through the 7 WordPress blog metrics that genuinely matter, plus 5 popular ones you can safely stop watching.
Why Most Bloggers Track the Wrong WordPress Blog Metrics
Here’s the core problem: the metrics that are easiest to see are often the least useful. GA4’s default overview shows total users, sessions, and pageviews. Those numbers feel important because they’re big and they change daily. However, they tell you almost nothing about whether your content is actually working.
Effective WordPress blog metrics share three qualities. First, they connect to a specific goal — growing your audience, increasing engagement, or driving conversions. Second, they’re actionable, meaning you can change your strategy based on what they tell you. Third, they remain stable enough to show real trends rather than random noise.
Most vanity metrics fail on at least two of these criteria. Total pageviews, for instance, can go up simply because you published more posts — not because your content improved. As a result, you feel productive without actually making progress.
Additionally, many bloggers track metrics in isolation rather than in context. A bounce rate of 70% means nothing without knowing the page type, traffic source, and user intent. Similarly, “time on page” is meaningless for a 200-word recipe card versus a 3,000-word guide. Context transforms raw numbers into actual insights.
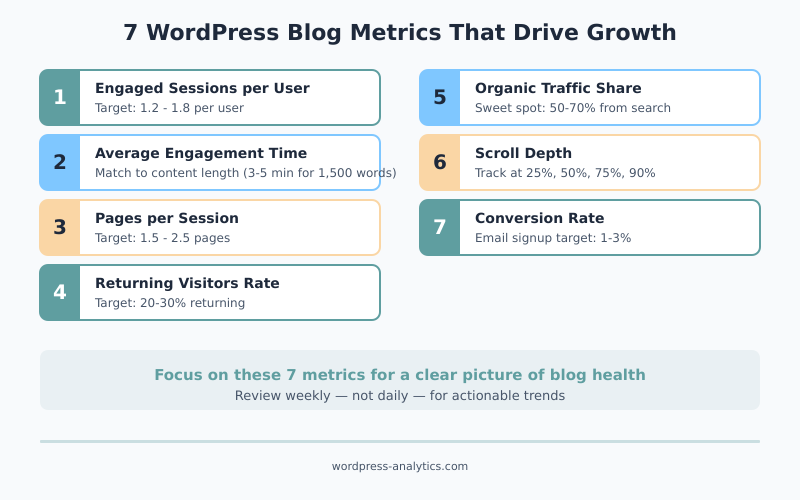
The 7 WordPress Blog Metrics That Actually Drive Growth
These are the metrics I check on every WordPress site I work with. Each one connects directly to audience growth, content quality, or revenue potential.
Engaged Sessions per User
This metric tells you how many meaningful sessions each visitor has on your site. In GA4, an engaged session lasts at least 10 seconds, includes a conversion event, or has 2+ page views. Therefore, it filters out people who land on your site and immediately leave.
A healthy WordPress blog sees 1.2-1.8 engaged sessions per user. If your number is below 1.0, most visitors aren’t finding your content engaging enough to stick around. Consequently, you should focus on improving your content quality and internal linking rather than driving more traffic.
To find this metric, go to Reports → Engagement → Overview in GA4. It’s also available as a custom metric in the Explorations tool.
Average Engagement Time
Average engagement time measures how long visitors actively interact with your content. Unlike the old “average session duration” in Universal Analytics, this metric only counts time when your page is in the foreground and the user is active. As a result, it’s far more accurate.
For blog content, aim for engagement times that roughly match your content length. A 1,500-word article should see 3-5 minutes of engagement time. If visitors spend only 30 seconds on a long-form guide, they’re not reading — they’re scanning and leaving. In other words, your content isn’t holding their attention.
Pages per Session
Pages per session shows whether visitors explore your site beyond the page they landed on. For WordPress blogs, this metric reflects two things: the quality of your internal linking and how well your content inspires curiosity.
Most WordPress blogs average 1.5-2.5 pages per session. If you’re consistently below 1.5, your internal linking strategy needs work. Furthermore, consider whether your sidebar, related posts section, and in-content links actually guide readers to relevant content. A well-structured site naturally encourages exploration.
Returning Visitors Rate
New visitors are great, but returning visitors are what build a sustainable blog. This metric shows the percentage of your audience that comes back for more. In GA4, check the “New vs returning” comparison in the User attributes section.
A returning visitor rate of 20-30% is solid for a content blog. Below 15% means you’re a “one and done” site — people find you, get what they need, and never come back. To improve this, focus on building an email list, creating content series, and establishing a consistent publishing schedule. Essentially, give readers a reason to return.
Organic Traffic Share
Organic traffic share is the percentage of your total traffic that comes from search engines. For WordPress blogs focused on long-term growth, this is one of the most important WordPress blog metrics to monitor.
A mature WordPress blog typically gets 50-70% of its traffic from organic search. If your organic share is below 30%, your content isn’t ranking well enough to sustain growth without constant promotion. On the other hand, if it’s above 85%, you’re too dependent on Google — one algorithm update could cut your traffic in half. To check this, review your GA4 traffic acquisition report and look at the channel breakdown.
Scroll Depth
Scroll depth tells you how far down the page visitors actually read. GA4 tracks scroll events automatically at the 90% threshold, but for blog content, you want more granular data — 25%, 50%, 75%, and 90% markers.
This metric is especially useful for long-form content. If most readers scroll past 75%, your content structure is working. If they drop off at 25%, your introduction might be weak or the content doesn’t match the headline’s promise. Specifically, a major drop-off at any point tells you exactly where to improve your content. You can set up custom scroll tracking through GA4’s enhanced measurement settings.
Conversion Rate (Even Without a Store)
You don’t need an e-commerce store to track conversions. For WordPress blogs, a conversion can be an email signup, a contact form submission, a PDF download, or even a click on an affiliate link. What matters is defining what “success” means for your site and measuring it.
In GA4, you can mark any event as a key event (conversion). A typical blog conversion rate for email signups is 1-3%. If yours is below 1%, your calls-to-action need improvement. If it’s above 5%, you’re doing something right — figure out what and replicate it across your site.
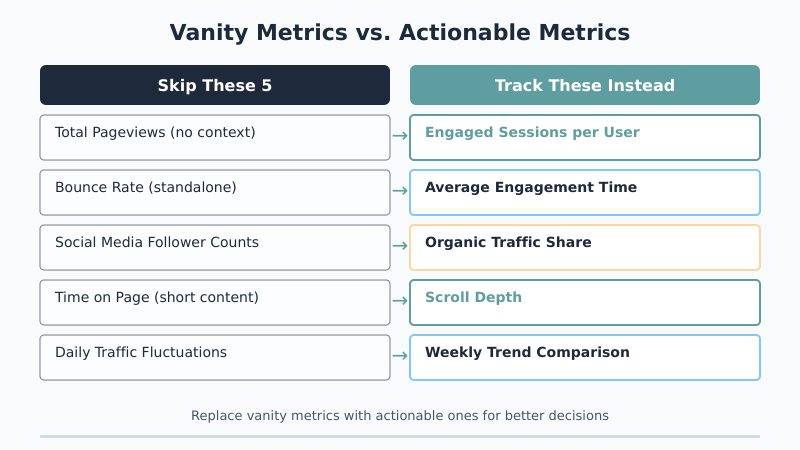
5 WordPress Blog Metrics You Can Safely Ignore
These metrics aren’t useless — they’re just commonly misunderstood and over-prioritized. Consequently, tracking them leads to bad decisions more often than good ones.
Total Pageviews (Without Context)
Pageviews as a standalone number is the ultimate vanity metric. Publishing 10 posts in a week will increase your pageviews regardless of quality. Similarly, a viral post can inflate your numbers for a month while doing nothing for long-term growth.
The problem isn’t pageviews themselves — it’s tracking them without context. Pageviews per post, pageviews per visitor, or pageviews by traffic source all provide useful context. However, celebrating “we hit 50,000 pageviews this month!” without knowing why is meaningless. Instead, focus on engagement metrics that measure quality, not just volume.
Bounce Rate as a Standalone Number
Bounce rate has confused bloggers for years. In GA4, a “bounce” is essentially a non-engaged session — a visit that lasts under 10 seconds with no conversion or additional page view. But here’s what most people miss: a high bounce rate isn’t always bad.
If someone searches “what time zone is New York,” lands on your post, gets the answer in 5 seconds, and leaves — that’s a successful visit despite being a “bounce.” Therefore, evaluating bounce rate requires understanding the intent behind each page. For WordPress blogs with a mix of quick-answer and deep-dive content, a site-wide bounce rate number is practically useless.
Social Media Follower Counts
Your Twitter followers and Facebook page likes have almost no correlation with blog traffic or revenue. I’ve seen blogs with 50,000 followers on social media generate fewer visitors than sites with 2,000 engaged email subscribers.
Social follower counts are a platform metric, not a blog metric. They measure your presence on someone else’s property — a property whose algorithm can change overnight. Instead of tracking followers, track how much actual traffic social media sends to your WordPress site. That’s the number that matters for your business.
Time on Page for Short-Form Content
Tracking average time on page makes sense for a 2,500-word guide. It makes zero sense for a 300-word announcement post, a contact page, or a category archive. Yet GA4 shows this metric for every page, and bloggers often worry when short pages show 15-second averages.
The fix is simple: only evaluate time-based metrics on content that’s designed to be read at length. For short-form content, scroll depth and conversion events are better indicators of success. Essentially, match the metric to the content type.
Daily Traffic Fluctuations
Checking your analytics daily is a habit that feels productive but usually isn’t. WordPress blog traffic naturally fluctuates based on day of the week, time of year, algorithm updates, and random chance. A 15% drop on a Tuesday compared to Monday is almost never meaningful.
Instead, compare week-over-week or month-over-month trends. A consistent downward trend over 4-6 weeks is a real signal. A single bad day is noise. Consequently, checking your blog traffic performance weekly rather than daily leads to better decisions and less anxiety.
How to Build a Simple WordPress Blog Metrics Dashboard
Now that you know which WordPress blog metrics matter, you need an efficient way to track them. Here’s a simple dashboard setup that takes 15 minutes:
Option 1: GA4 Custom Report. In GA4, go to Explore → Blank and create a free-form exploration. Add these dimensions: Page path, Session default channel grouping. Add these metrics: Engaged sessions, Average engagement time, Conversions, Sessions. Save it and check it weekly.
Option 2: Looker Studio (Free). Google’s Looker Studio connects directly to GA4 and lets you build visual dashboards. Create a single-page report with scorecards for your 7 key metrics and a chart showing trends over time. Furthermore, you can share this dashboard with your team.
Option 3: WordPress Plugin. If you prefer staying inside WordPress, plugins like MonsterInsights or Site Kit surface key metrics in your admin dashboard. They won’t show every metric listed above, but they cover the essentials without leaving WordPress.
Regardless of which option you choose, the key principle is the same: build a view that shows your 7 key metrics in one place. If checking your analytics requires clicking through 5 different reports, you won’t do it consistently.
Putting It Into Practice — A Weekly Review Routine
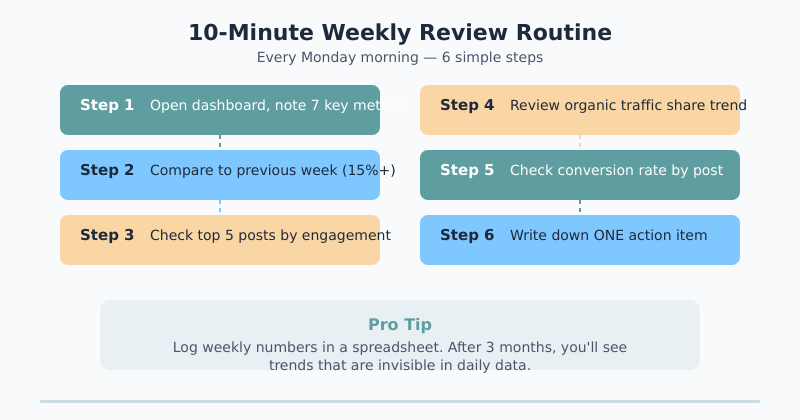
Here’s the exact weekly review routine I recommend for WordPress bloggers. It takes about 10 minutes:
- Monday morning: Open your dashboard and note the previous week’s numbers for your 7 key metrics.
- Compare to the previous week. Look for changes greater than 15% — anything smaller is likely normal variation.
- Check your top 5 posts by engaged sessions. Are they the same posts as last week, or has something shifted?
- Review organic traffic share. Is it growing, stable, or declining? A steady decline over 3+ weeks means your SEO needs attention.
- Check conversion rate. Did any specific post drive unusually high or low conversions?
- Write down one action item. Based on what you see, identify one thing to improve this week. Just one.
This routine works because it’s focused and repeatable. You’re not drowning in data — you’re looking at 7 specific numbers and making one decision. Over time, those weekly improvements compound into significant growth.
Additionally, keep a simple spreadsheet or note where you log your weekly numbers. After a month, you’ll start seeing trends that are invisible in daily data. After three months, you’ll have a clear picture of what’s working and what needs to change.
Bottom Line
Not all WordPress blog metrics deserve your attention. Focus on the seven that connect directly to growth: engaged sessions per user, average engagement time, pages per session, returning visitors rate, organic traffic share, scroll depth, and conversion rate. These metrics are actionable, contextual, and genuinely predictive of long-term success.
Meanwhile, let go of total pageviews without context, standalone bounce rate, social follower counts, time on page for short content, and daily traffic fluctuations. They feel important but lead you nowhere useful.
The WordPress bloggers who grow consistently aren’t the ones with the fanciest analytics setup. They’re the ones who track a small number of meaningful metrics, review them weekly, and make one improvement at a time. Start this week — pick your 7 metrics, set up a simple dashboard, and give yourself 10 minutes every Monday to check in. That’s all it takes.

Written by Ellie
Former Head of Analytics at a European digital agency. 8+ years making WordPress analytics make sense. Google Analytics certified. I write the guides I wish existed when I started.
More about me →