Getting traffic is one thing — getting people to come back is another. The GA4 retention report shows you whether readers are returning to your WordPress site or vanishing after a single visit. For most content sites, the answer is not encouraging. But understanding the data is the first step toward fixing it.
In this guide, you will learn what the GA4 retention report actually shows, how to find it, what the numbers mean for WordPress sites, and how to improve reader loyalty over time.
What the GA4 Retention Report Shows You
The GA4 retention report answers a simple question: after someone visits your site, do they come back?
Specifically, it tracks two things:
- New users — people visiting your site for the first time during the selected period
- Returning users — people who visited before and came back
Additionally, the report includes user retention and user engagement charts that show day-by-day retention. For example, if 1,000 people visited on Day 0, the chart shows how many came back on Day 1, Day 2, Day 7, and so on.
This is fundamentally different from just looking at traffic volume. A site with 10,000 monthly visitors sounds impressive — until you realize 98% of them never return. In contrast, a site with 5,000 monthly visitors where 30% are returning users has a much healthier audience. The GA4 retention report makes this distinction clear.
Google defines retention using first-party cookies and User-ID, so the tracking is based on browser or device. If someone visits on their phone and returns on their laptop, GA4 may count them as two different users — unless you have User-ID or Google Signals enabled.
How to Find the GA4 Retention Report
Finding the retention report in GA4 takes about 10 seconds, but it is buried in a spot most people overlook.
- Open Google Analytics 4
- In the left sidebar, click Reports
- Expand Retention (under the Life cycle section)
- Click Retention overview
You will see several cards:
- New vs returning users — a line chart comparing both over time
- User retention by cohort — shows what percentage of users return on each subsequent day
- User engagement by cohort — tracks engagement time for returning users
Note: If you don’t see the Retention section, your GA4 property might be using a customized report navigation. Go to Library (bottom of the left sidebar) and check whether the Life cycle collection is published.
For a deeper analysis, you can also build custom retention explorations using Explore → Cohort exploration. However, the standard report is enough for most WordPress site owners.
New vs Returning Users — What the Numbers Mean for WordPress
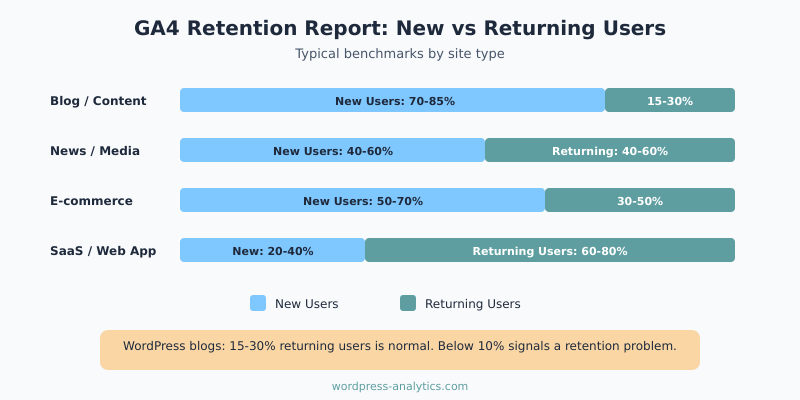
The new vs returning users split varies dramatically by site type. Here is what to expect:
| Site Type | New Users | Returning Users | Notes |
|---|---|---|---|
| Blog / Content site | 70-85% | 15-30% | Search-driven traffic is mostly new |
| News / Media | 40-60% | 40-60% | Regular readers return daily |
| E-commerce | 50-70% | 30-50% | Repeat buyers boost retention |
| SaaS / Web app | 20-40% | 60-80% | Logged-in users return frequently |
If you run a WordPress blog that relies on organic search, seeing 80% new users is completely normal. Search traffic is inherently new — people type a question into Google, find your post, get the answer, and leave. That is how search works.
However, a returning user rate below 10% suggests a problem. It means almost nobody finds your site valuable enough to bookmark, subscribe, or revisit. As a result, you are completely dependent on search engines for every single visit.
On the other hand, if your returning user rate is above 25% for a content site, you are doing something right. That usually means you have an email list, strong brand recognition, or content that people reference repeatedly. For instance, a WordPress analytics tutorial that people bookmark and return to when setting up new sites would drive repeat visits.
Cohort Analysis: Tracking Reader Loyalty Over Time
The cohort retention chart in GA4 is the most revealing part of the retention report. It groups users by the week they first visited, then tracks how many returned in subsequent weeks.
Here is how to read it:
- Week 0 — the week a user first visited (this is always 100%)
- Week 1 — the percentage who came back the following week
- Week 2-8+ — ongoing retention in later weeks
For most WordPress content sites, the drop between Week 0 and Week 1 is steep — often from 100% down to 5-10%. That is normal for search-driven content. The key metric to watch is whether the line flattens out. If it does, you have a core group of loyal readers.
Specifically, look for the “retention floor” — the point where the line stops dropping. If your retention floor is at 3-5% after 4 weeks, that means for every 1,000 new visitors, 30-50 become regular readers. That may sound small, but over months it compounds into a significant loyal audience.
Furthermore, you can compare cohorts over time. If your Week 1 retention improved from 4% in January to 7% in March, something you did is working. Maybe you started an email newsletter, improved your internal linking, or began publishing more consistently.
Why WordPress Sites Struggle with Retention (And How to Fix It)
WordPress content sites have a natural disadvantage when it comes to retention. Most visits come from search, and search users are looking for a specific answer — not a long-term relationship. Nevertheless, there are concrete ways to improve your GA4 retention numbers.
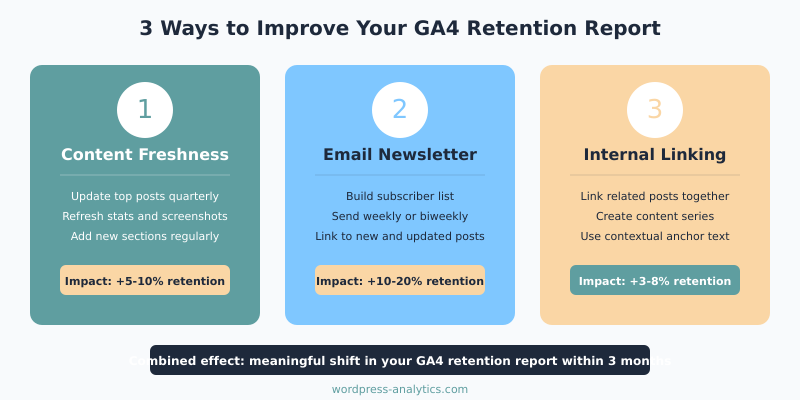
Content Freshness
If your content never changes, there is no reason to come back. Updating posts regularly — adding new data, expanding sections, refreshing screenshots — gives returning visitors something new to find. It also signals to Google that your content is current.
In my experience, sites that update their top 10 posts quarterly see measurably better retention than those that only publish new content.
Email Lists
An email list is the single most effective retention tool for WordPress sites. Search traffic is rented — email traffic is owned. When you send a newsletter linking to a new post, those readers show up as returning users in your GA4 retention report.
Even a small list of 500 subscribers who click through regularly can shift your returning user percentage by several points.
Internal Linking
Strong internal linking keeps people on your site longer and increases the chance they will remember you. If someone reads your post about bounce rate vs engagement rate and discovers three more useful articles through internal links, they are more likely to bookmark your site.
Similarly, creating content series — where one post leads naturally to the next — encourages readers to return for the next installment. This approach works especially well for tutorial-style WordPress content.
What a Good GA4 Retention Rate Looks Like
There is no single “good” retention rate because it depends on your site type and traffic sources. However, here are some benchmarks to aim for:
- Day 1 retention (content sites): 5-12% is typical. Above 15% is excellent.
- Week 1 retention: 4-8% for blogs. Above 10% means you have strong engagement.
- Returning user share (monthly): 15-25% for search-driven blogs. Above 30% is outstanding.
More important than the absolute number is the trend. If your retention is improving month over month, you are building an audience. If it is declining, something changed — maybe your content quality dropped, your email frequency decreased, or a Google algorithm update shifted your traffic mix.
To track these trends effectively, set up a monthly check where you compare retention metrics. You can also use your data filters and segments to isolate specific traffic sources and see which ones produce the most loyal readers. Typically, email and direct traffic retain far better than organic search.
Bottom Line
The GA4 retention report tells you something that traffic numbers alone cannot — whether you are building an audience or just renting one from Google. For WordPress sites, a returning user rate of 15-25% is normal, and anything above that means your content and engagement strategy is working.
Check your retention report monthly, watch for the retention floor in your cohort charts, and focus on the three levers that actually move the needle: content freshness, email lists, and internal linking. Traffic that comes back is worth ten times more than traffic that bounces once and disappears.